
Infographics
Infographics have become essential because audiences are overloaded with information and short on time. Whether the reader is a patient in a waiting room, a busy clinician, or a client weighing a partner, most people skim before they commit to reading, and dense text is easy to skip. Infographics solve this by turning complex information into something people can grasp in seconds.
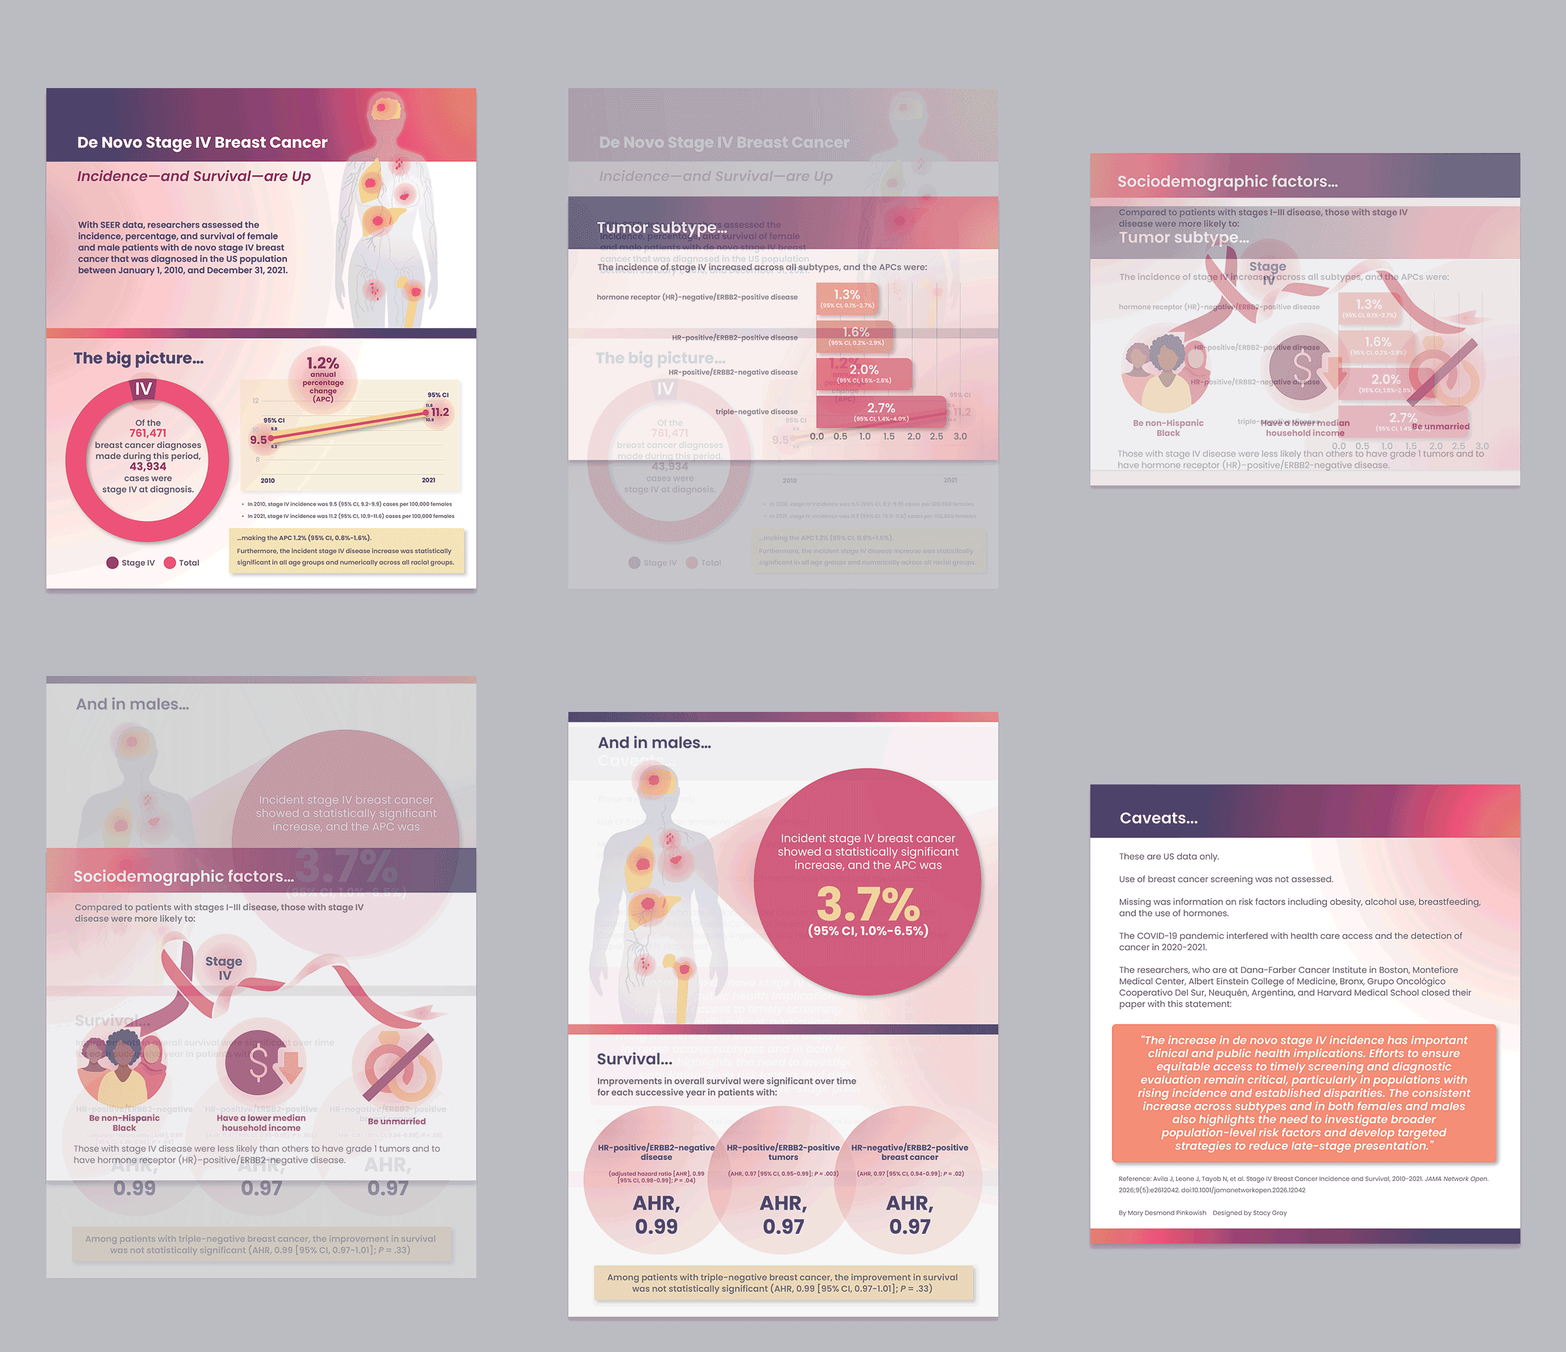
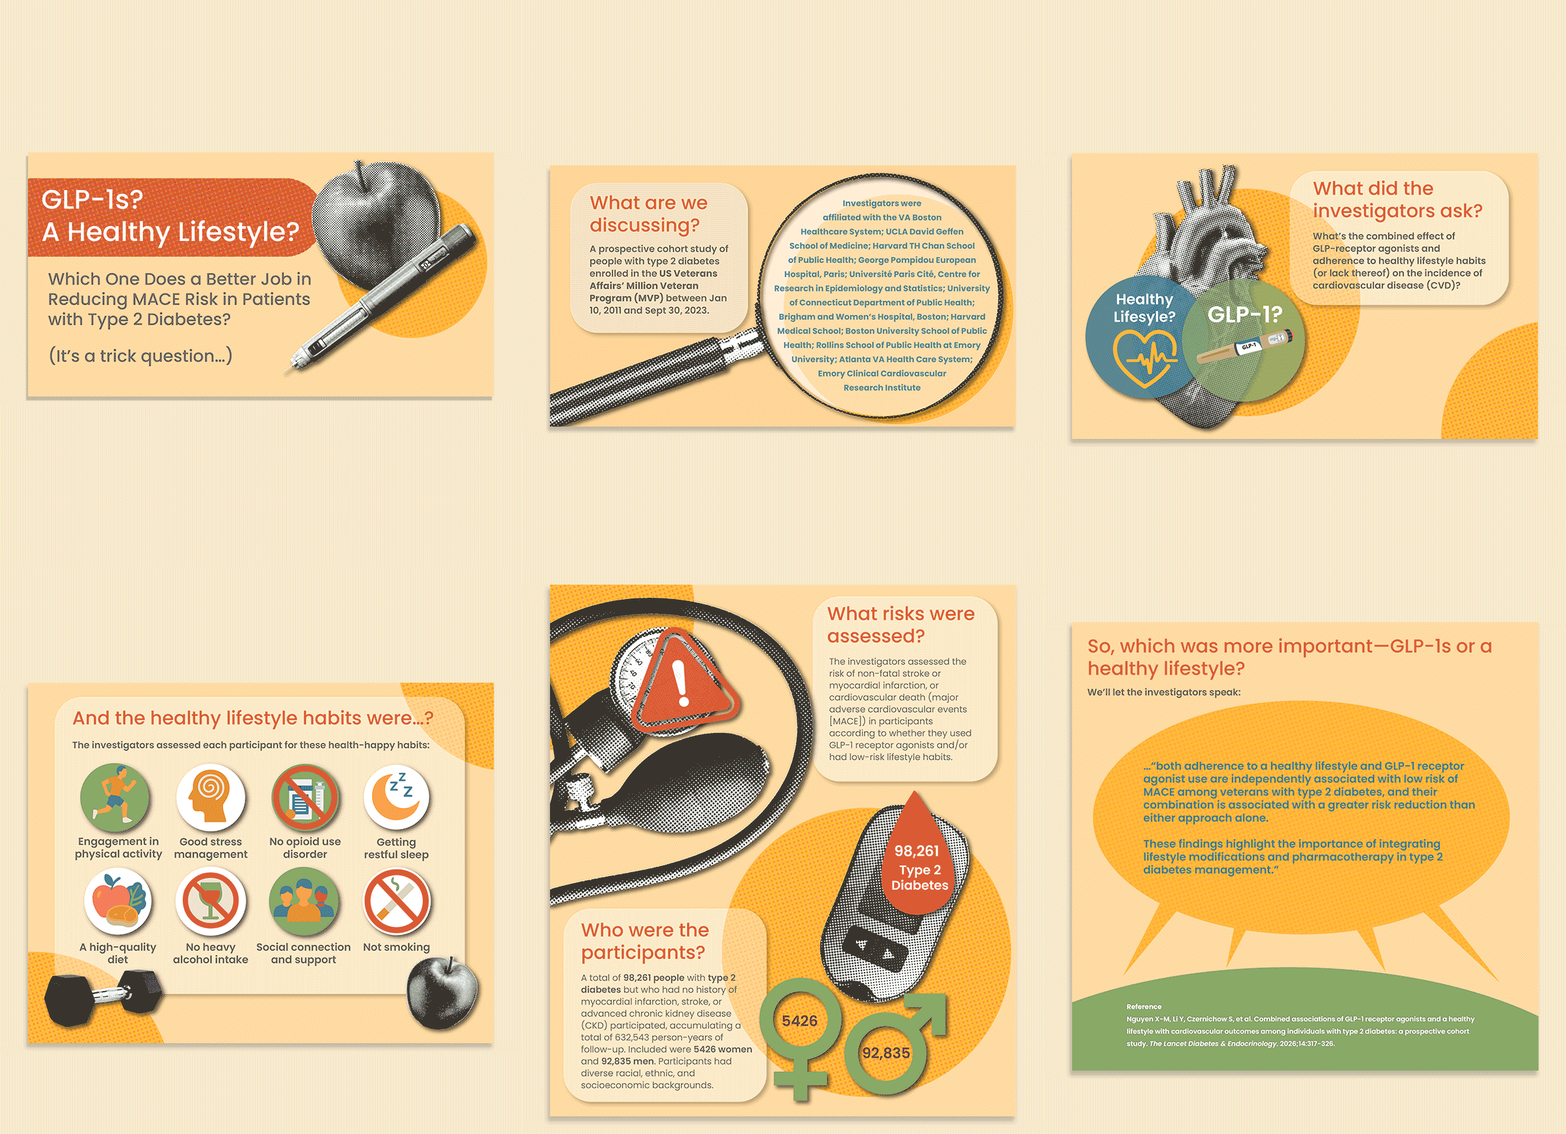
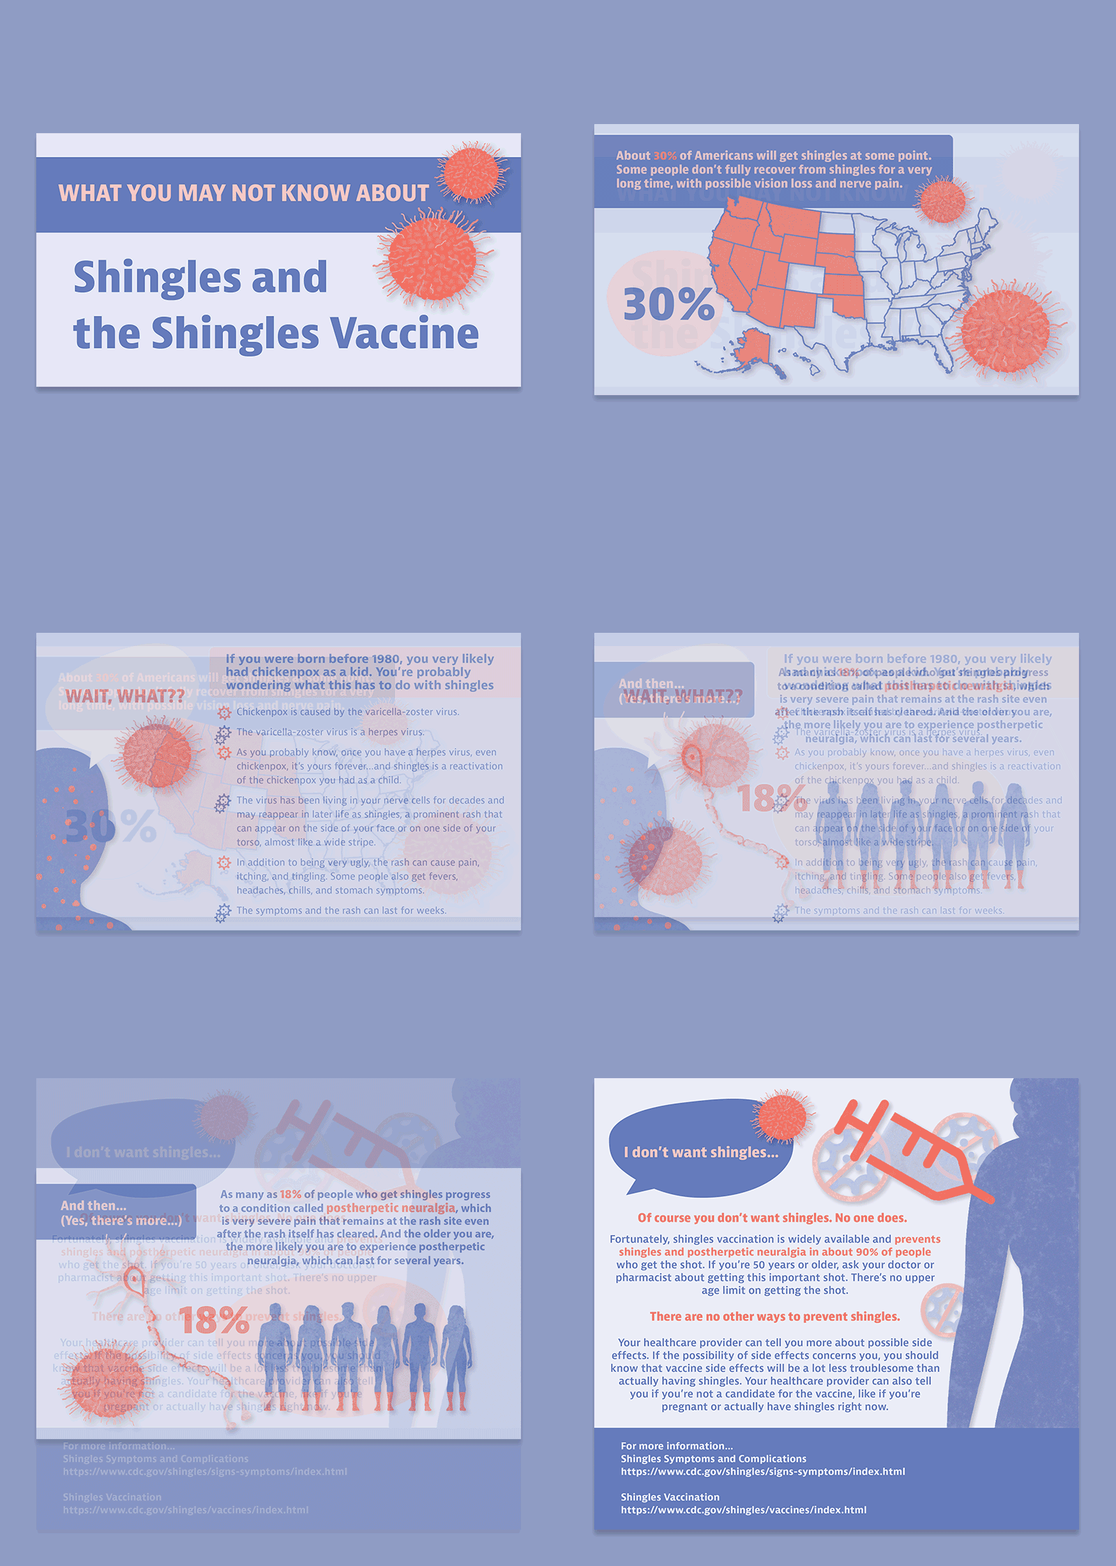
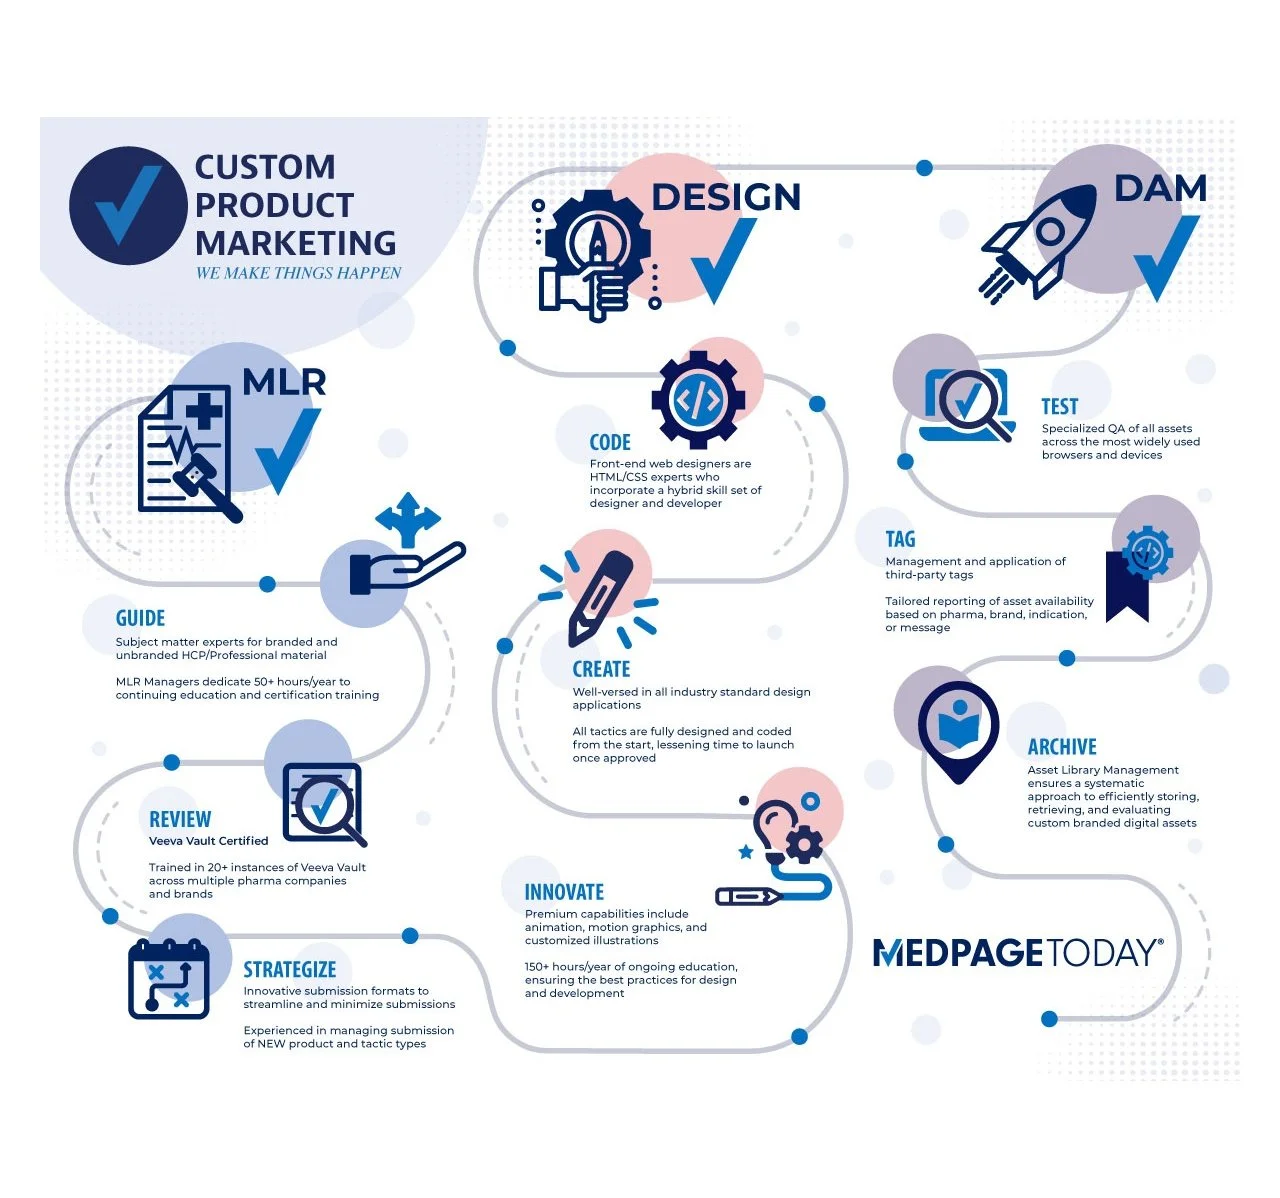
This collection shows how infographics can turn complex information into clear, memorable stories for very different audiences. The GLP-1 and Healthy Lifestyle infographic opens with a “trick question” about whether medication or healthy habits do more to reduce cardiovascular risk in type 2 diabetes. It walks viewers through a large veterans’ study to reveal that the two work best together. The Shingles and the Shingles Vaccine infographic uses a conversational, animated format to connect childhood chickenpox to adult shingles risk. It moves from striking statistics on lasting nerve pain to a reassuring call to get vaccinated. The De Novo Stage IV Breast Cancer infographic distills a national cancer-registry study into a clinician-focused story. It shows that late-stage diagnoses are rising across every subtype and in both women and men, highlights the disparities behind the trend, and notes that survival is improving. The Custom Product Marketing infographic turns to the business side, tracing a single winding path through the MLR, Design, and DAM teams to show how each stage hands off seamlessly to the next. Together, the four pieces demonstrate the same core strength: pairing data and visuals with a clear narrative so audiences understand the message quickly and know what to do next.